.png)
Single-Point-of-Failure (SPoF) attacks are only becoming more common across various industries. The growing reliance on software means it’s essential that (re)insurers have a view of technologies that the businesses they insure are connected to. Cyber risk analytics — like CyberCube’s SPoF Intelligence — can provide this data.
In the second part of this two-part blog series about SPoF attacks, we’ll use examples to explore how a unique solution like SPoF Intelligence can fully equip you with the dependency data you need.
You can check out the first part of the series where we covered the evolution of SPoFs, modeled vs. non-modeled SPoFs, and how this data can help you make profitable decisions as a cyber (re)insurer here — How to improve your portfolio management decisions with SPoF Intelligence.
So how can a SPoF-specific cyber analytics solution provide modeled and non-modeled data on SPoFs to help provide a forward-looking view of accumulation risk?
SPoF Intelligence in action
Let’s look at CyberCube’s SPoF Intelligence module in action, focusing on non-modeled SPoFs.
With such a large universe of potential SPoFs, it might be a daunting task to determine where to begin. SPoF Intelligence is able to quickly filter down this list of SPoFs to those with identified dependencies for companies in your portfolio(s). The table below summarizes the unique SPoFs and tech dependencies found in a sample portfolio created to reflect the companies in the Russell 3000 stock market index.
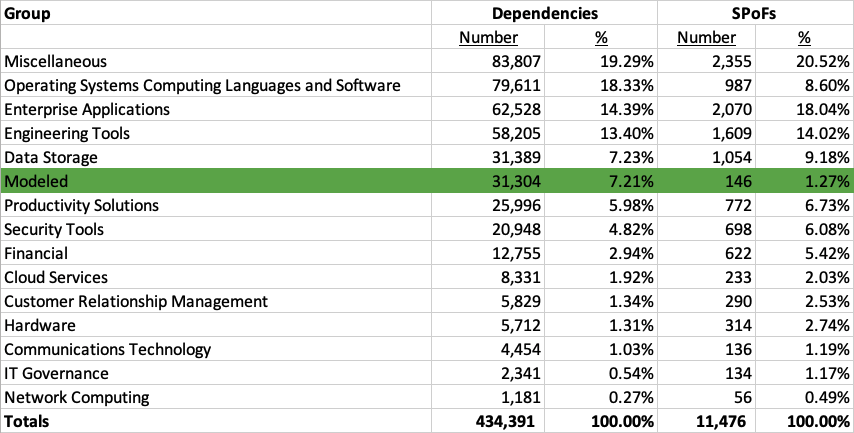
Exhibit 1: Data from SPoF Intelligence represented in a spreadsheet.
SPoF Intelligence is unlike any other cyber risk modeling solution — it provides a wide range of data, displaying both modeled and non-modeled dependencies and SPoFs. Of the largest Non-Modeled SPoF groups, one that has had a few incidents recently is “Engineering Tools.” We can see that for the Russell 3000 and Engineering Tools, there are roughly 1,600 SPoFs, and ~58,000 dependencies. Given the sheer number of SPoFs, it would be impractical to evaluate them all.
Starting with the largest SPoFs, by count or exposed limit, might yield some intuition on what deserves a closer look. Exhibit 2 below shows how the top Non-Modeled Engineering Tools SPoFs compare to the top Modeled SPoFs.
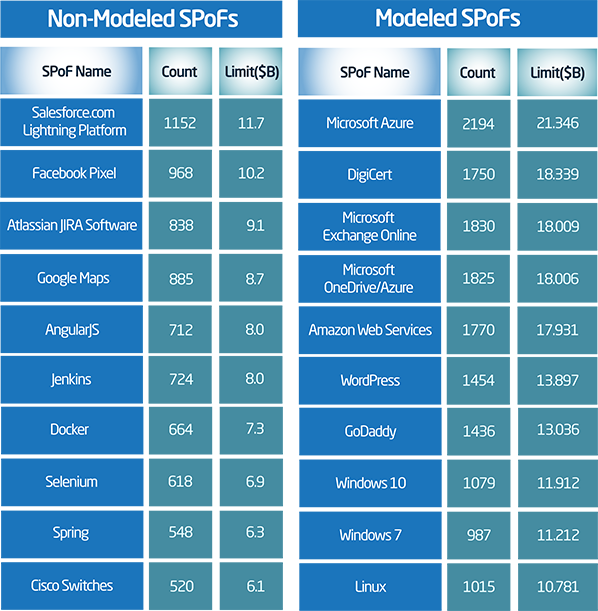
Exhibit 2: A visualization of modeled and non-modeled SPoF Intelligence data.
Interestingly, the top Non-Modeled Engineering Tools SPoFs represent significant exposure, on par with some of the top modeled SPoFs. We’ve considered many of these SPoF types within our scenarios for the cat model, and have initially left them out of the modeled SPoFs due to their relatively “low” market share when compared with the market share leaders of the same type. However, we constantly review our non-modeled SPoFs and consider additions and subtractions to our scenario catalogs.
Security and exposure scores
Given the complex cyber landscape, the magnitude of the SPoF accumulation might not tell the full story. All things being equal, cyber threat actors would prefer to attack the largest SPoFs, but there is a complex trade-off of risk-reward in cyber attacks. CyberCube’s Security and Exposure Scores provide additional insight into how likely various SPoFs are to be at the center of a catastrophic cyber incident.
- The CyberCube Exposure Score is a measure of a company's inherent cyber risk properties, based on its digital and operational risk footprint as well as the external threat landscape that can make it susceptible to an attack.
- The CyberCube Security Score is a single composite cybersecurity metric that summarizes a company’s observed security signals. The nearly 50 signals within CyberCube’s solutions are curated from a wide range of threat vector data, and represent how well a company is positioned with respect to all components of the National Institute of Standards and Technology (NIST) Framework.
Both Exposure and Security scores go from 0-100 — having a higher security score is better while having a higher exposure score is worse. These non-modeled SPoFs are common technologies provided by big organizations that “everyone” has a lot of dependency to, so they will naturally have a high exposure score. However, some of them have better security than others.
Using the Exposure and Security Scores along with the Exposed Limit from the Engineering Tools SPoFs, we've generated the following bubble plot. The graph below represents an interesting way to understand the complex dynamics of these risks rather than focusing on each score or metric in isolation, illustrating which companies are on the safer/riskier side.
.png?width=1540&name=image%20(3).png)
Exhibit 3: Data from SPoF Intelligence represented in a graph created in a spreadsheet.
Four of the top non-modeled SPoFs have been highlighted and the data clearly shows that Cisco Switches has a higher relative likelihood of being involved in a cyber attack compared to the others of similar size in this portfolio. Having access to these types of analytics can help ensure you are making informed decisions to manage your risk concentrations and avoid financial losses in the long term.
The SolarWinds attack in SPoF Intelligence
Alternatively to looking at the largest accumulation potential, you can see how SPoF Intelligence can be used by understanding the potential impact of an identified cyber event. Let’s look at a recent large cyber event: the SolarWinds attack.
The attack was led over a series of months beginning in September 2019 by Russian threat actors. They deployed espionage SUNBURST malware via the SolarWinds Orion product, which includes Network Performance Monitor (NPM), to target over 3,000 organizations in the private and public sectors including the U.S. Department of Defense. The event drew attention to the Engineering Tools group within SPoF Intelligence.
SolarWinds’ exposure and security
If the initial evaluation of potential SPoF accumulations didn’t include SolarWinds, the first question we might want to ask is how SolarWinds compares to the other SPoFs we’ve already reviewed. When sorting this group (Engineering Tools) by the portfolio’s limit exposed to each SPoF, we see SolarWinds NPM is around the 207th largest exposure (out of the 1,600 SPoFs that have identified dependencies within this portfolio), representing 68 company dependencies exposing just under $1B of Limit.
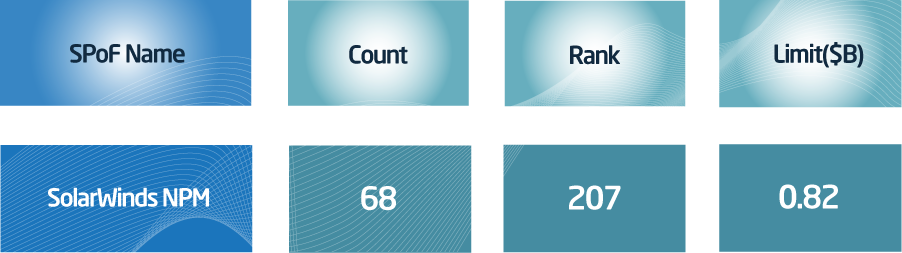
Exhibit 4: A visualization of SPoF Intelligence data on SolarWinds dependencies within this sample portfolio
The relatively low exposed limit to SolarWinds for this particular portfolio may have not led to initial investigation, but let’s revisit the 2D plot of Exposure and Security Scores to see what additional information we can uncover.
%20(1).png?width=1540&name=image%20(1)%20(1).png)
Exhibit 5: Security and Exposure score data pulled from SPoF Intelligence on a scatter plot created in a spreadsheet.
Isolating SolarWinds NPM on the 2D plot illustrates why it might have been left out of the preliminary review focusing on large exposed limit SPoFs in the bottom right quadrant (high exposure scores and low security scores), but does draw attention to SolarWinds’ notably low Security Score.
The 2D plot above has been enhanced on the top and right borders to show the distribution of the Exposure and Security Scores. It's quickly revealed that a Security Score of 22 for SolarWinds can be viewed as an outlier relative to the other SPoFs in the Engineering Tools categorization. In other words, SolarWinds has a smaller digital and operational risk footprint to attack relative to its peers, but has significantly lower security hygiene to thwart any potential attacks.
As noted above, the Security Score is a composite of a wide range of security control categories and signals. If you’d like to delve deeper into these categories and signals, CyberCube’s single-risk underwriting solution, Account Manager, provides a wide range of analytics data around this.
SPoF Intelligence includes a summary of a commonly requested signal — Software Vulnerabilities identified by their CVE (Common Vulnerability Enumerations). If we look at the number of critical vulnerabilities in the exhibit 5 below, we see that SolarWinds has more critical vulnerabilities than 65% of other Engineering Tools SPoFs.
.png?width=1540&name=image%20(2).png)
Exhibit 6: Data from SPoF Intelligence represented in a graph created in a spreadsheet.
All in all, we can see that SolarWinds is fairly risky in comparison to its peers as a potential for causing a cyber incident, and this portfolio is fortunate not to be too highly exposed to it. Ultimately, this is the kind of information that is critical for you to effectively manage your risk. It all comes down to choosing the right cyber modeling solution that can help you identify where your risks are most concentrated.
In the case of a cyber event (like SolarWinds)
While using a tool like SPoF Intelligence mitigates your risk as much as possible, there is still a chance of a cyber attack, so you need to ensure you and your clients are prepared. During the early days of a cyber event, it is critical to understand and communicate the potential impact to insured portfolio(s).
At the most granular level, SPoF Intelligence provides a list of all identified company dependencies, which means when an event like the SolarWinds attack occurs, you can immediately look in your portfolio to see which companies are likely to be affected, their exposed limits, and begin mobilizing your claims response. As identified earlier, 68 companies with just under $1B of exposed limits have identified dependencies to SolarWinds. SPoF Intelligence allows us to evaluate these identified dependencies at various resolutions, as shown in the table below, which provides the top ten dependencies identified.
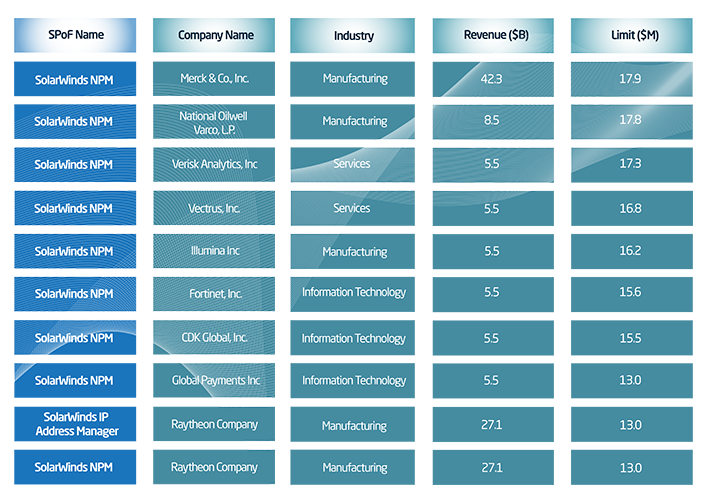
Exhibit 7: A revisualization of the SolarWinds' top ten dependencies from SPoF Intelligence.
You can also see data at a higher level — the dependencies to SolarWinds can be summarized at the micro-segment level. With 68 dependent companies, this might seem overkill but for larger portfolios with tens or hundreds of thousands of companies, the list of dependent companies could be orders of magnitude larger. In this case, dedicating additional resources to the most heavily impacted micro segments can help prioritize critical resources. SPoF Intelligence provides that industry-level data, as presented in the following heatmap table.
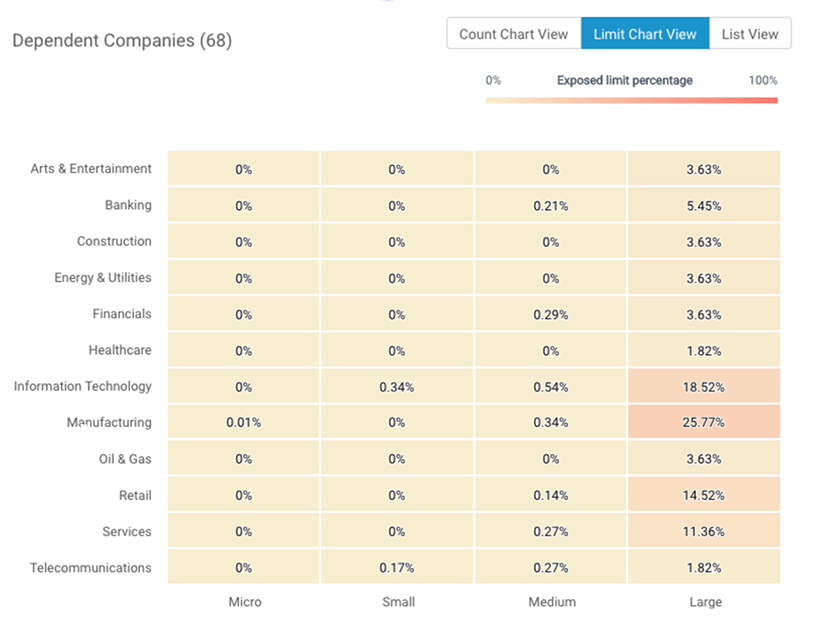
Exhibit 8: Sample heatmap of SolarWinds' dependencies by industry from SPoF Intelligence.
The SolarWinds attack highlights just how vital it is to have access to the right data and analytics to help (re)insurers gain a forward-looking view of risk. Gaining insight into the dependencies and SPoFs a business has can help address the overarching impact a cyber attack will have on different industries within a portfolio.
Want to learn more about the impact of the SolarWinds cyber attack? We get into the details and learn about its implications on the insurance industry in a past blog — The SolarWinds hack.
The future of cyber accumulation events
As the world continues to become ever more connected, having a powerful catastrophe model isn’t enough — it is also critical to have the capability to consider cyber accumulation from every angle. Portfolio managers need effective and proactive monitoring and hotspot management to help ensure concentrations do not grow too large.
Meanwhile, accumulation events will keep happening. And as they do, SPoF Intelligence will be able to give immediate information on the company at the center of an incident as well as the connections to it from companies in your portfolio. Going forward, this means you can identify other non-modeled SPoFs that have potential to impact your future profitability, which no other cyber analytics solution can do.
If you’d like to learn more about how we use our catastrophe model to better understand accumulation and supply chain attacks, check out our report — Building Blocks of a Catastrophe Scenario.

.png)