In this post - the second in our technology series - we'll see how we can improve logging and store the logs into external systems, such as Kibana.
Here at CyberCube, we send our logs to Logstash/Kibana for further processing, which could be debugging, analytics, monitoring etc. For serverless modules, Lambda functions send their logs to the same log collector.
Logs are a very important part of any solution, and having a good approach on how to collect and store them is crucial. CloudWatch provides basic functionality and we will discuss why we need another way to handle log data.
Cloudwatch
Cloudwatch provides the easiest way to log whatever we want on AWS.
It's trivial to write a log into it as all you need to do is call console.log() just like this:
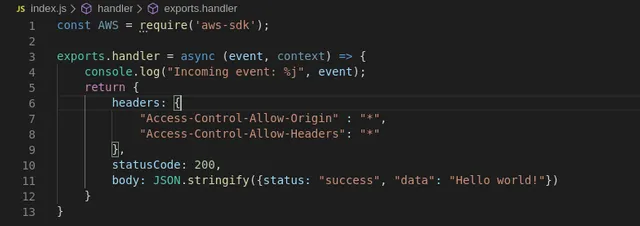
With just that one line, we can look at the log group for our Lambda and we will see the following:
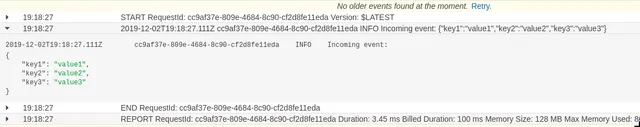
That's quite useful but we're lacking a few good features that we'd get with a more advanced logging mechanism.
Building your own
You can build your own logging helper, but of course there are a few of those that exist, such as Winston, which will create logs and will be able to write them to Cloudwatch, or Logstash, for example. This is quite powerful and should be good for most people, but in the interest of this post, we'll implement a much smaller and simpler layer.
One reason why I don't use Winston to send logs to Logstash (and eventually to Kibana) is that when there are a lot of logs, Winston needs to connect to Logstash and sometimes, it times out, which may cause the Lambda to fail (as it can also time out).
Log levels
When we are building our own logging helper, we can specify logging levels such as those:
- DEBUG
- INFO
- WARNING
- ERROR
We could have a couple more, but usually, those four are enough.
We can then implement our logging function.
The corresponding code to use the function can be like this:
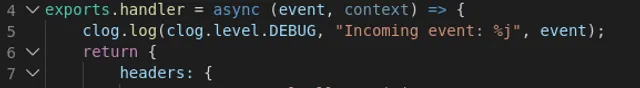
It looks very similar to console.log() but it includes a level, in this case: DEBUG
For the logging to work properly with the specified level, an environment variable must be defined:
LOG_LEVEL
You will need to assign it the default level based on the staging. For example, if you are deploying in a DEV environment, your API GW will most likely need to have LOG_LEVEL = DEBUG. In a production environment, you probably want to keep it at WARNING.
You can find the source for the layer here
Further into the module
We are now using the customLog layer to send logs to Cloudwatch and we included a log level, which for now is pretty much useless.
The end goal is to send those logs to Logstash, but as I mentioned earlier, we don't want to send logs to Logstash directly from the layer because it will slow the Lambda down a little bit, and if there are connectivity issues, our Lambdas will suffer.
Caching
What we can do is to cache the logs. Actually, if we think of it, that's pretty much what Cloudwatch does.
How can we cache the logs?
There are a few choices, but I decided to use Redis. I could have used the AWS Memcached service, but since I have some experience with Redis, I thought it would be simpler.
Essentially, what I did was to store the logs by category and put them into a specific hash.
DEBUG => logs_debug
INFO => logs_info
So on, so forth. For the key, I simply used the uuid module and generated a new uuid per log.
The log.js file shows how to connect to Redis and then how to insert each log in to its respective hash.
Dumping the cache
Now that we have our logs into the Redis cache, we need to send them to Logstash.
In order to do this, we need a Lambda that will read the values from Redis, format them and send them to Logstash using the Winston module.
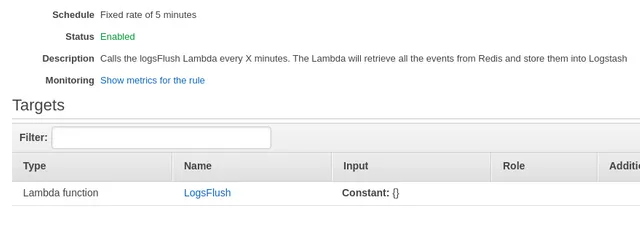
We need that Lambda to be triggered somehow, and a cron job type of thing would be perfect. I could probably have created a step function or something but there's a much easier way:
Cloudwatch Event Rules
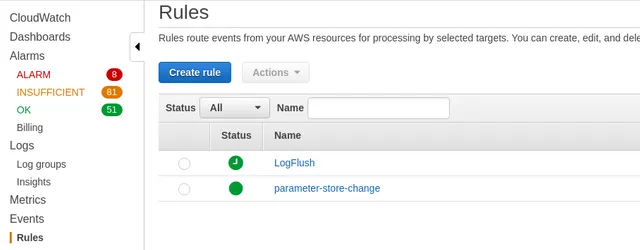
As we can see here, I have created a rule named LogFlush. It's actually fairly easy to create as you merely need to specify how often to run and what Lambda function to call.
The code for the LogFlush Lambda function is here
The code for that Lambda can be improved (notably the lack of check for the return code of the log2stash() function)
The formatting given to Winston is very simple, but it contains a label, which you can set to just about anything you want. This is helpful if you're storing logs for multiple applications in Kibana.
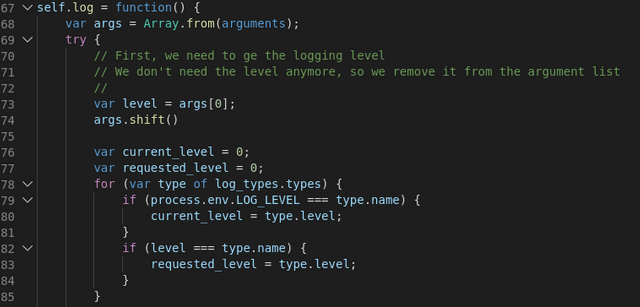
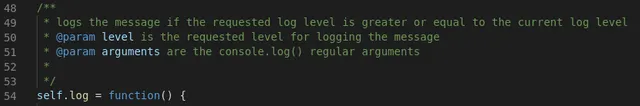
The log() function
I think that our code of the log() function (in the custom log layer) needs a little more explanation:
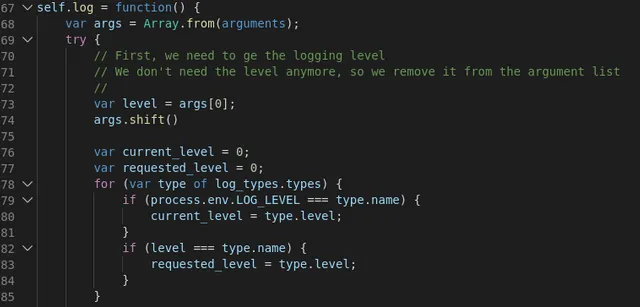
The function is defined in the .TS file as: log(options?:any) and that allows us to use the parameters as an ellipsis, something similar to what we'd do in C:
void printf(const char* format, ...) { }
The first thing we need to do is to retrieve the log level, which must be the first parameter and then, we can remove it from the array and use that array in the util.format() function.
That's all there is to it. There might be some other ways of doing so, but this is the simplest I could figure out.

.png)